




22 Feb The Montreal Real Estate Market Outlook for 2026


The Montreal Real Estate Market Outlook for 2026
The Montreal Real Estate Market Outlook for 2026 is quite complicated as it’s necessary to take a deeper dive into the numbers to get an actual understanding of what’s going on.
Here’s an infographic and a podcast that get’s into greater details and analysis based on January 2026 market stats.
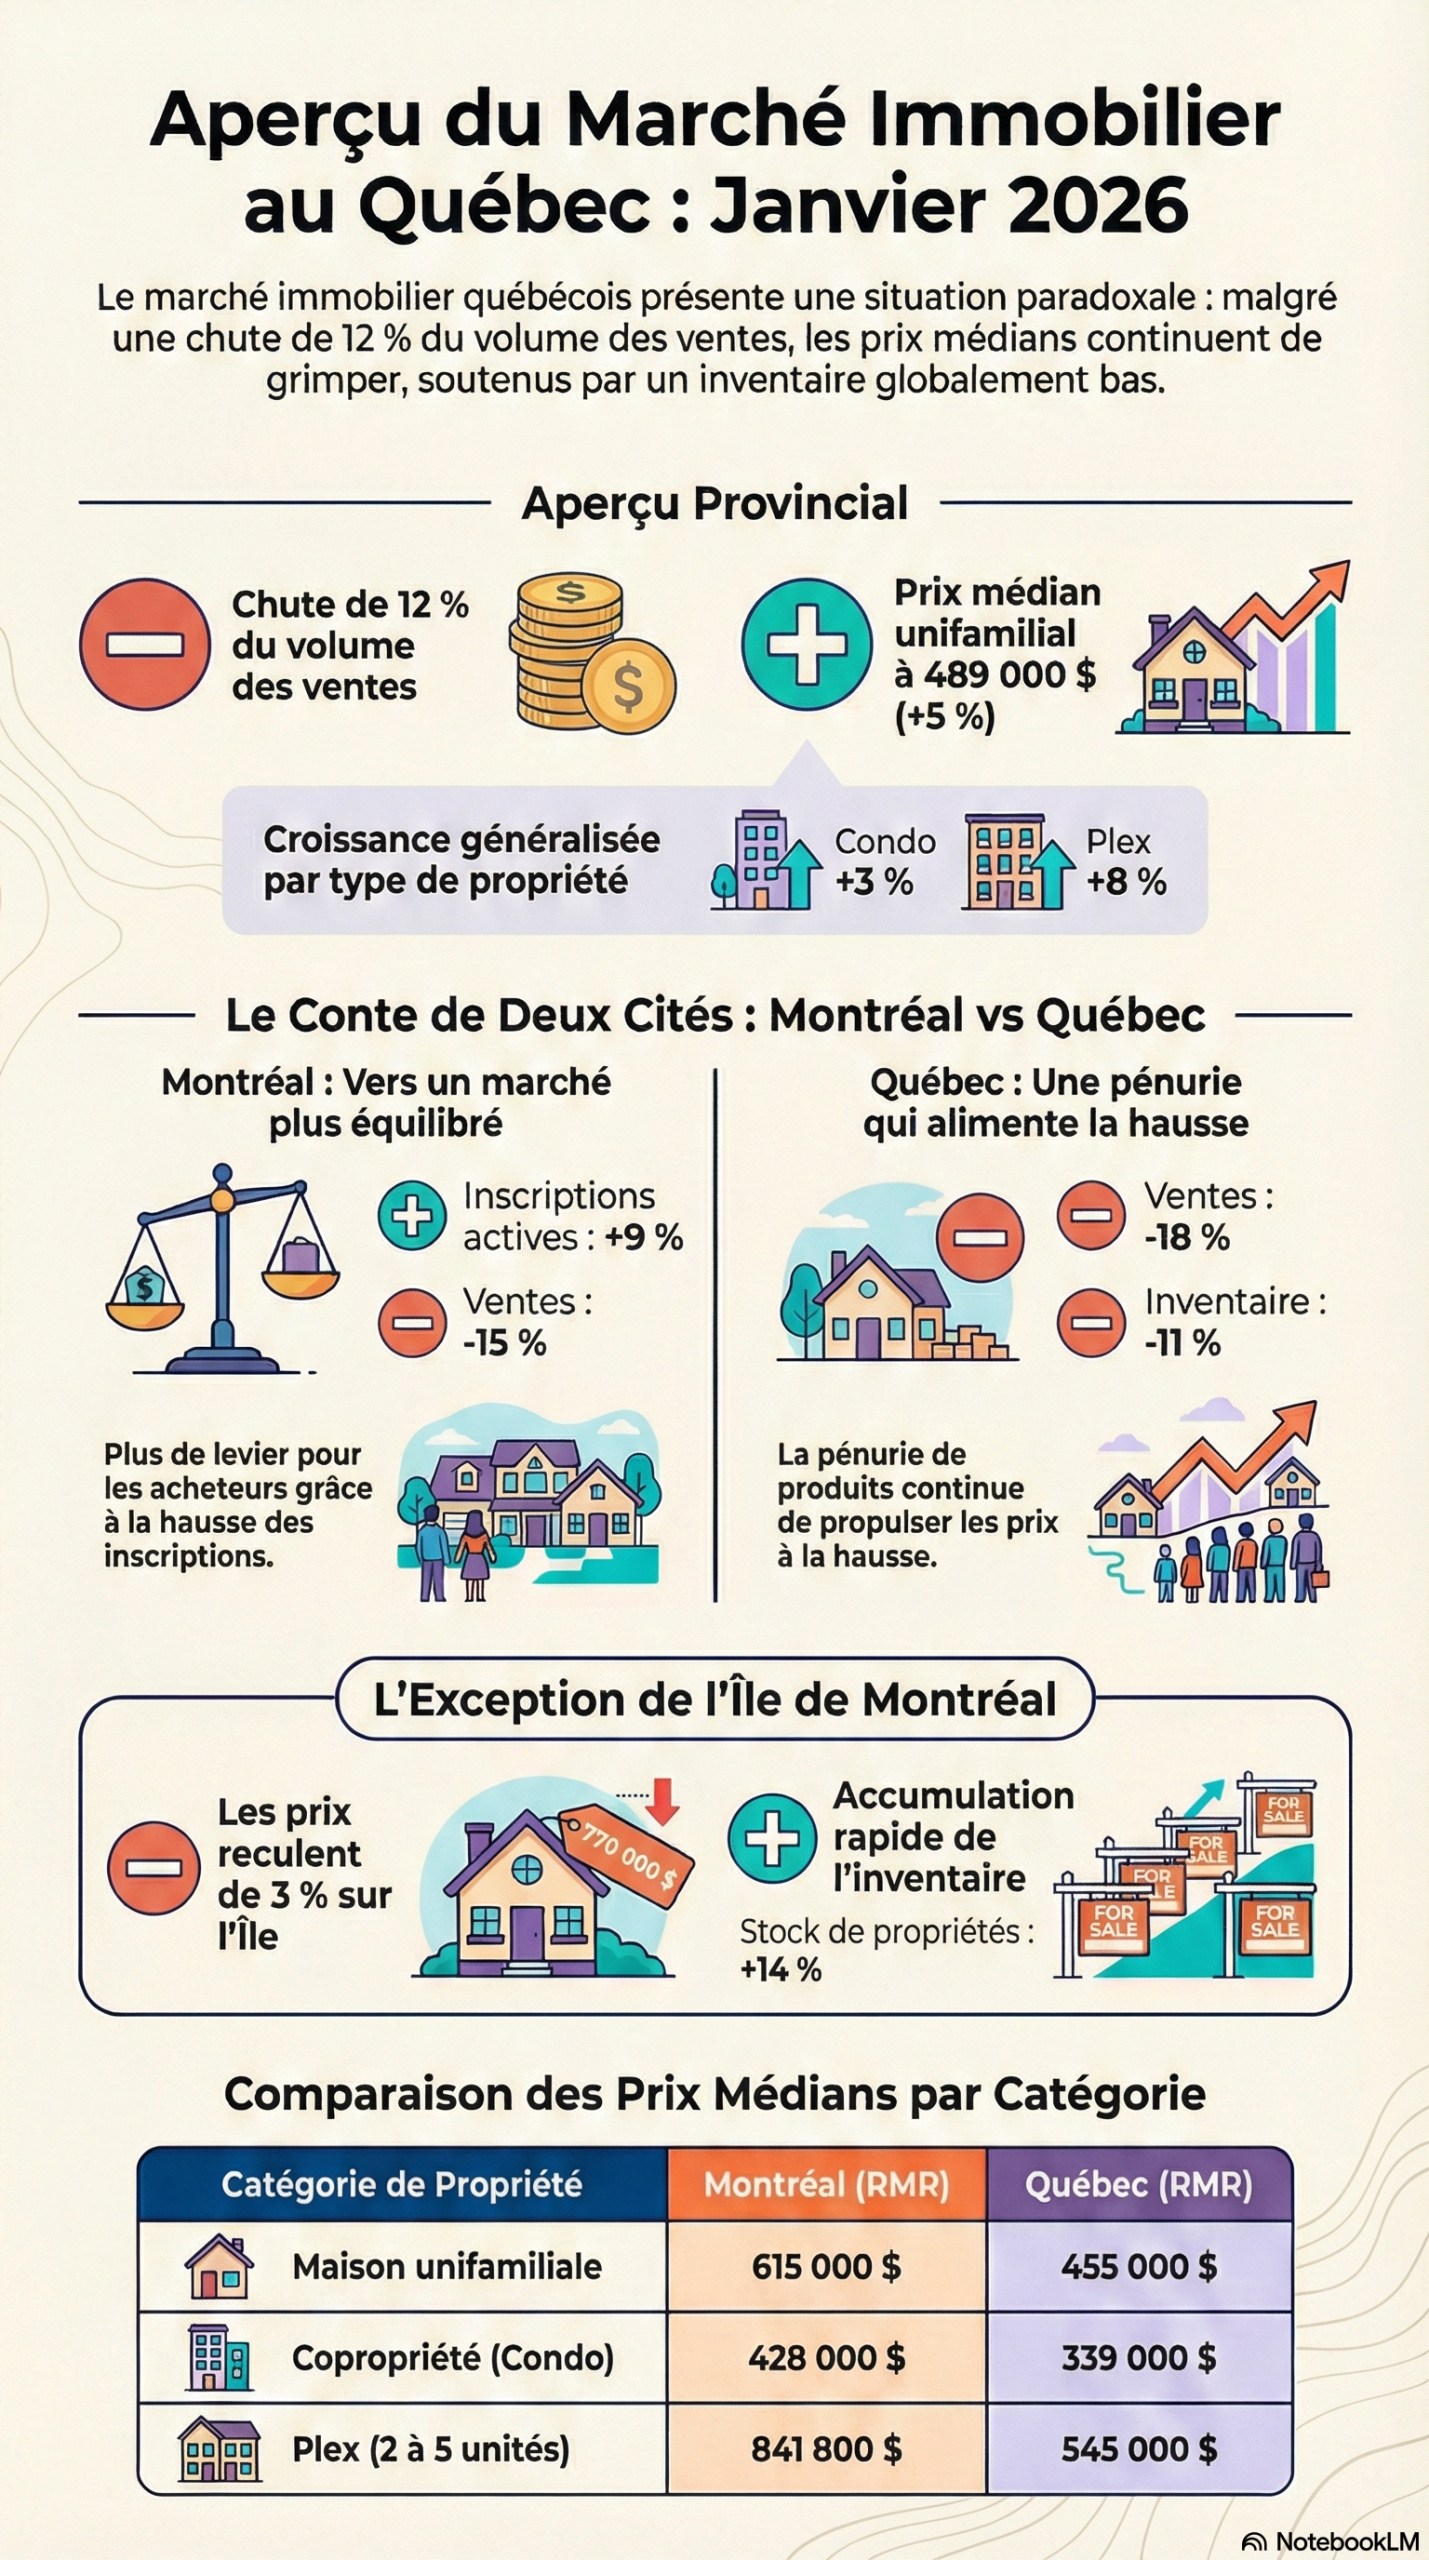
January 2026 Quebec Residential Real Estate Market Report
1. Province of Quebec: General Market Performance – data via Centris/APCIQ
1.1 High-Level Activity Summary The residential real estate market in Quebec began 2026 with a notable slowdown in transaction volume, contrasted by a shortening of the average time required to secure a sale. The following table provides a comprehensive overview of Centris activity for the province.
|
Metric |
January 2026 |
January 2025 |
Variation (%) |
|
Total Sales |
5,094 |
5,818 |
-12% |
|
Sales Volume |
$2,741,189,647 |
$2,967,434,204 |
-8% |
|
Active Listings |
33,656 |
32,684 |
+3% |
|
New Listings |
12,245 |
11,701 |
+5% |
|
Average Days on Market |
55 |
68 |
-13 days |
1.2 Key Provincial Trends
- Transaction Contraction: Total sales decreased by 12% across the province. This reduction in activity led to a total sales volume of approximately $2.74 billion, an 8% decline from the previous year.
- Inventory Shifts: While active listings saw a modest 3% increase, the 5% rise in new listings suggests that sellers remain active despite the cooling transaction environment.
- Resilience of the Plex Segment: While Single-Family and Condominium sales saw double-digit declines, the Plex segment (2-5 units) remained stable with a 1% increase in sales. This suggests sustained investor appetite and strong demand for rental-generating properties in a shifting economy.
- Accelerated Market Pace: Despite fewer sales, the average time to sell dropped by 13 days compared to January 2025, indicating that well-priced properties are being absorbed efficiently by the market.
1.3 Performance by Property Category The market continues to show price appreciation across all segments, though the pace of sales varies significantly by property type.
|
Property Category |
Sales (Var.) |
Median Price 2026 |
Median Price 2025 |
Avg. Days on Market |
|
Single-Family Home |
-13% |
$489,000 |
$465,000 |
55 |
|
Condominium |
-15% |
$399,900 |
$390,000 |
65 |
|
Plex (2-5 units) |
+1% |
$650,000 |
$603,750 |
62 |
——————————————————————————–
2. Montreal CMA: Detailed Regional Analysis
2.1 CMA Market Overview The Montreal Census Metropolitan Area (CMA) recorded a substantial 15% drop in total sales (2,364 units). Unlike the provincial average, Montreal experienced a significant 9% increase in active listings, totaling 16,798 units, reflecting a gradual buildup of available inventory.
2.2 Montreal Sub-Region Performance Regional disparities remain evident across the Montreal area. While Laval and Saint-Jean-sur-Richelieu saw sharp declines, Vaudreuil-Soulanges bucked the trend as the only sector to record growth.
|
Sub-Region |
Total Sales |
Sales Variation (%) |
|
Island of Montreal |
851 |
-15% |
|
Laval |
191 |
-28% |
|
North Shore of Montreal |
586 |
-14% |
|
South Shore of Montreal |
559 |
-13% |
|
Vaudreuil-Soulanges |
119 |
+3% |
|
Saint-Jean-sur-Richelieu |
58 |
-25% |
2.3 Montreal Property Segment Insights Price growth remains a core feature of the Montreal market, particularly in high-density segments:
- Single-Family Homes: Median price reached $615,000, a 4% increase over 2025.
- Condominiums: Median price rose 2% to $428,000.
- Plexes (2-5 units): This segment showed the most aggressive appreciation with an 8% price jump to $841,800, highlighting the segment’s premium status among buyers despite broader sales contractions.
——————————————————————————–
3. Quebec City CMA: Detailed Regional Analysis
3.1 CMA Market Overview The Quebec City CMA continues to exhibit market “tightness” that stands in stark contrast to Montreal. While sales dropped by 18% (522 units), active listings also decreased by 11% (1,800 units). This simultaneous drop in supply and demand has kept upward pressure on prices and significantly reduced selling times.
3.2 Quebec City Sub-Region Performance Activity was down across all primary sectors in the capital region, with the South Shore experiencing the most significant pullback in transaction volume.
|
Sub-Region |
Total Sales |
Sales Variation (%) |
|
Agglomeration of Quebec City |
336 |
-15% |
|
Northern Periphery of Quebec City |
75 |
-7% |
|
South Shore of Quebec City |
111 |
-31% |
3.3 Price Growth Drivers Quebec City remains a seller’s market, characterized by double-digit price increases in its most accessible segments:
- Condominiums: A massive 15% surge brought the median price to $339,000. Most impressively, the average selling time for a condo in this CMA plummeted from 76 days to just 41 days—a 35-day reduction.
- Single-Family Homes: Experienced a strong 12% rise, with a median price of $455,000.
- Plexes (2-5 units): Recorded a 9% increase, reaching a median price of $545,000.
——————————————————————————–
4. Comparative Market Summary
4.1 CMA Contrast Table The diverging paths of the two major CMAs are most visible when comparing the Single-Family Home segment. Montreal’s inventory is stabilizing, whereas Quebec City’s supply continues to evaporate.
|
Metric (Single-Family) |
Montreal CMA |
Quebec City CMA |
|
Sales Variation (%) |
-17% |
-21% |
|
Active Listings Variation (%) |
+1% |
-17% |
|
Median Price Variation (%) |
+4% |
+12% |
4.2 Inventory and Absorption Trends Since May 1, 2025, the industry has utilized “Average days on market” as the definitive standard for market liquidity. In January 2026, the Quebec City CMA proved more reactive than Montreal, with an average time to sell of 40 days compared to 50 days in Montreal. The rapid absorption in Quebec City underscores a market where demand continues to outpace available inventory.
——————————————————————————–
5. Definitions and Methodology
5.1 Metric Clarification Average days on market: This metric reflects the time it takes for an active listing to find a buyer. Effective May 1, 2025, the QPAREB replaced “average selling time” with this measure to align with the standards of other Canadian real estate boards, providing a more consistent benchmark for national comparison.
5.2 Data Source Attribution All data is sourced from the Quebec Professional Association of Real Estate Brokers (QPAREB) through the Centris system. For detailed statistical inquiries, contact the Market Analysis Department:
- Email: stats@qpareb.ca
- Head Office (Quebec City): 990, avenue Holland, Québec (Québec) G1S 3T1
- Administrative Offices (Montreal): 600, chemin du Golf, L’Île-des-Soeurs (Québec) H3E 1B7
- Regional Office (Saguenay): 72, rue Jacques-Cartier O, bureau 20, Chicoutimi (Québec) G7J 1G2
- Website: qpareb.ca